Plot horizontal stacked bar charts that are scaled to 100% (figure type 3)
Source:R/rub_plot.R
rub_plot_type_3.RdPlot horizontal stacked bar charts that are scaled to 100% (figure type 3)
Usage
rub_plot_type_3(
  df,
  x_var,
  y_var,
  x_axis_label = NA_character_,
  fill_var,
  fill_label = NULL,
  fill_reverse = FALSE,
  legend_reverse = FALSE,
  facet_var = NULL,
  title = NA_character_,
  caption = "",
  caption_prefix = "Quelle:",
  filter_cutoff = 0.05,
  color = RUB_colors["blue"],
  palette_reverse = FALSE,
  base_family = get_font_df()[["family"]],
  base_size = 11,
  max_width_axis_text_y = 30,
  max_width_strip_label = 80,
  plot_width = 6.8
)
Arguments
- df
Data frame
- x_var
Required variable name for the variable containing the x-coordinates. Will be coerced to numeric with
as.numeric.- y_var
Required variable name for the variable containing the y-coordinates. Will be coerced to numeric with
as.numeric.- x_axis_label
Optional label for the x-axis, defaults to an empty string.
- fill_var
Variable name for the discrete variable which determines the groups to be stacked, e.g. degree.
- fill_label
Optional variable name for the character variable containing the names of the fill variable, defaults to NULL.
- fill_reverse
Boolean indicating whether the order of the fill variable should be reversed, defaults to FALSE.
- legend_reverse
Optional boolean indicating whether the legend should be reverted, defaults to FALSE.
- facet_var
Optional variable name for the discrete variable to facet by, defaults to NULL.
- title
Optional plot title
- caption
Optional character containing the data source for the figure (prefix 'Quelle:' is automatically added).
- caption_prefix
Optional character containing the prefix for the caption, defaults to 'Quelle:'.
- filter_cutoff
Optional cutoff value for the suppression of data labels. By default, all values below 0.04 of the total value of the stacked bar chart are suppressed.
- color
Color for font and borders, defaults to
RUB_colors["blue"], i.e. #003560.- palette_reverse
Optional boolean indicating whether the colors in the palette should be reversed, defaults to FALSE.
- base_family
base font family, defaults to RubFlama
- base_size
base font size, defaults to 11
- max_width_axis_text_y
Optional maximum width in characters for the text of the y axis.
- max_width_strip_label
Optional maximum width in characters for the facet label passed to ggplot2::label_wrap_gen.
- plot_width
Width of the plot in inches, defaults to 6.8
See also
Other rub_plot_types:
rub_plot_type_1_and_4(),
rub_plot_type_1(),
rub_plot_type_2(),
rub_plot_type_4()
Examples
# Create test data for all three mandatory variables (x_var, y_var,
# fill_var)
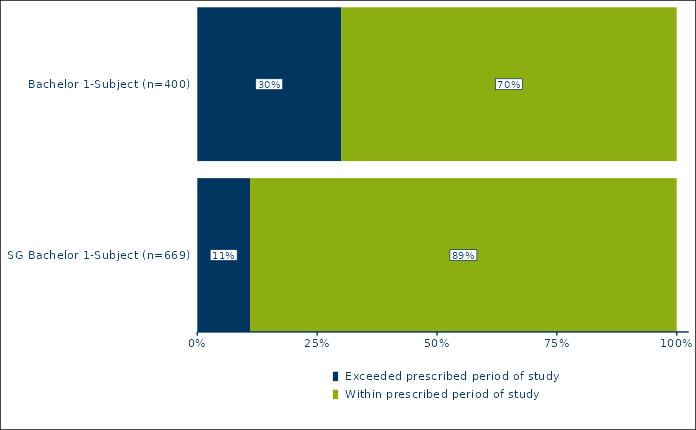
df_t3_ex1 <- tibble::tribble(
~survey_group, ~item_value, ~item_value_percentage,
"Bachelor 1-Subject (n=400)", "Exceeded prescribed period of study", 0.3,
"Bachelor 1-Subject (n=400)", "Within prescribed period of study", 0.7,
"SG Bachelor 1-Subject (n=669)", "Exceeded prescribed period of study", 0.11,
"SG Bachelor 1-Subject (n=669)", "Within prescribed period of study", 0.89
)
rub_plot_type_3(
df = df_t3_ex1,
x_var = item_value_percentage,
y_var = survey_group,
fill_var = item_value,
base_family = "sans"
)